Conversation
Jan Antoš
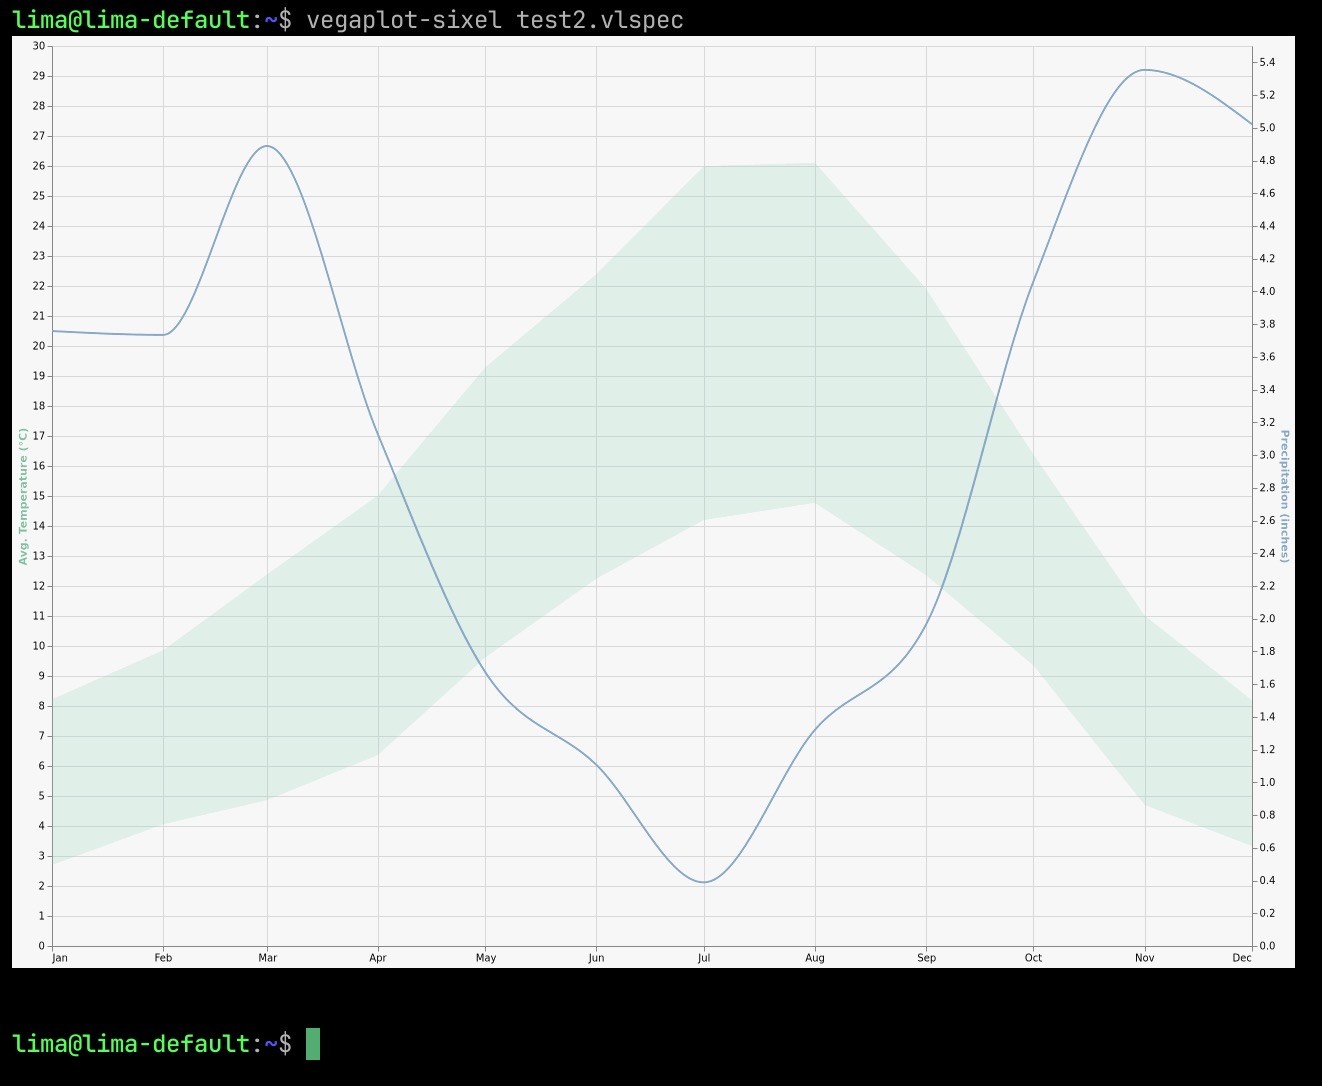
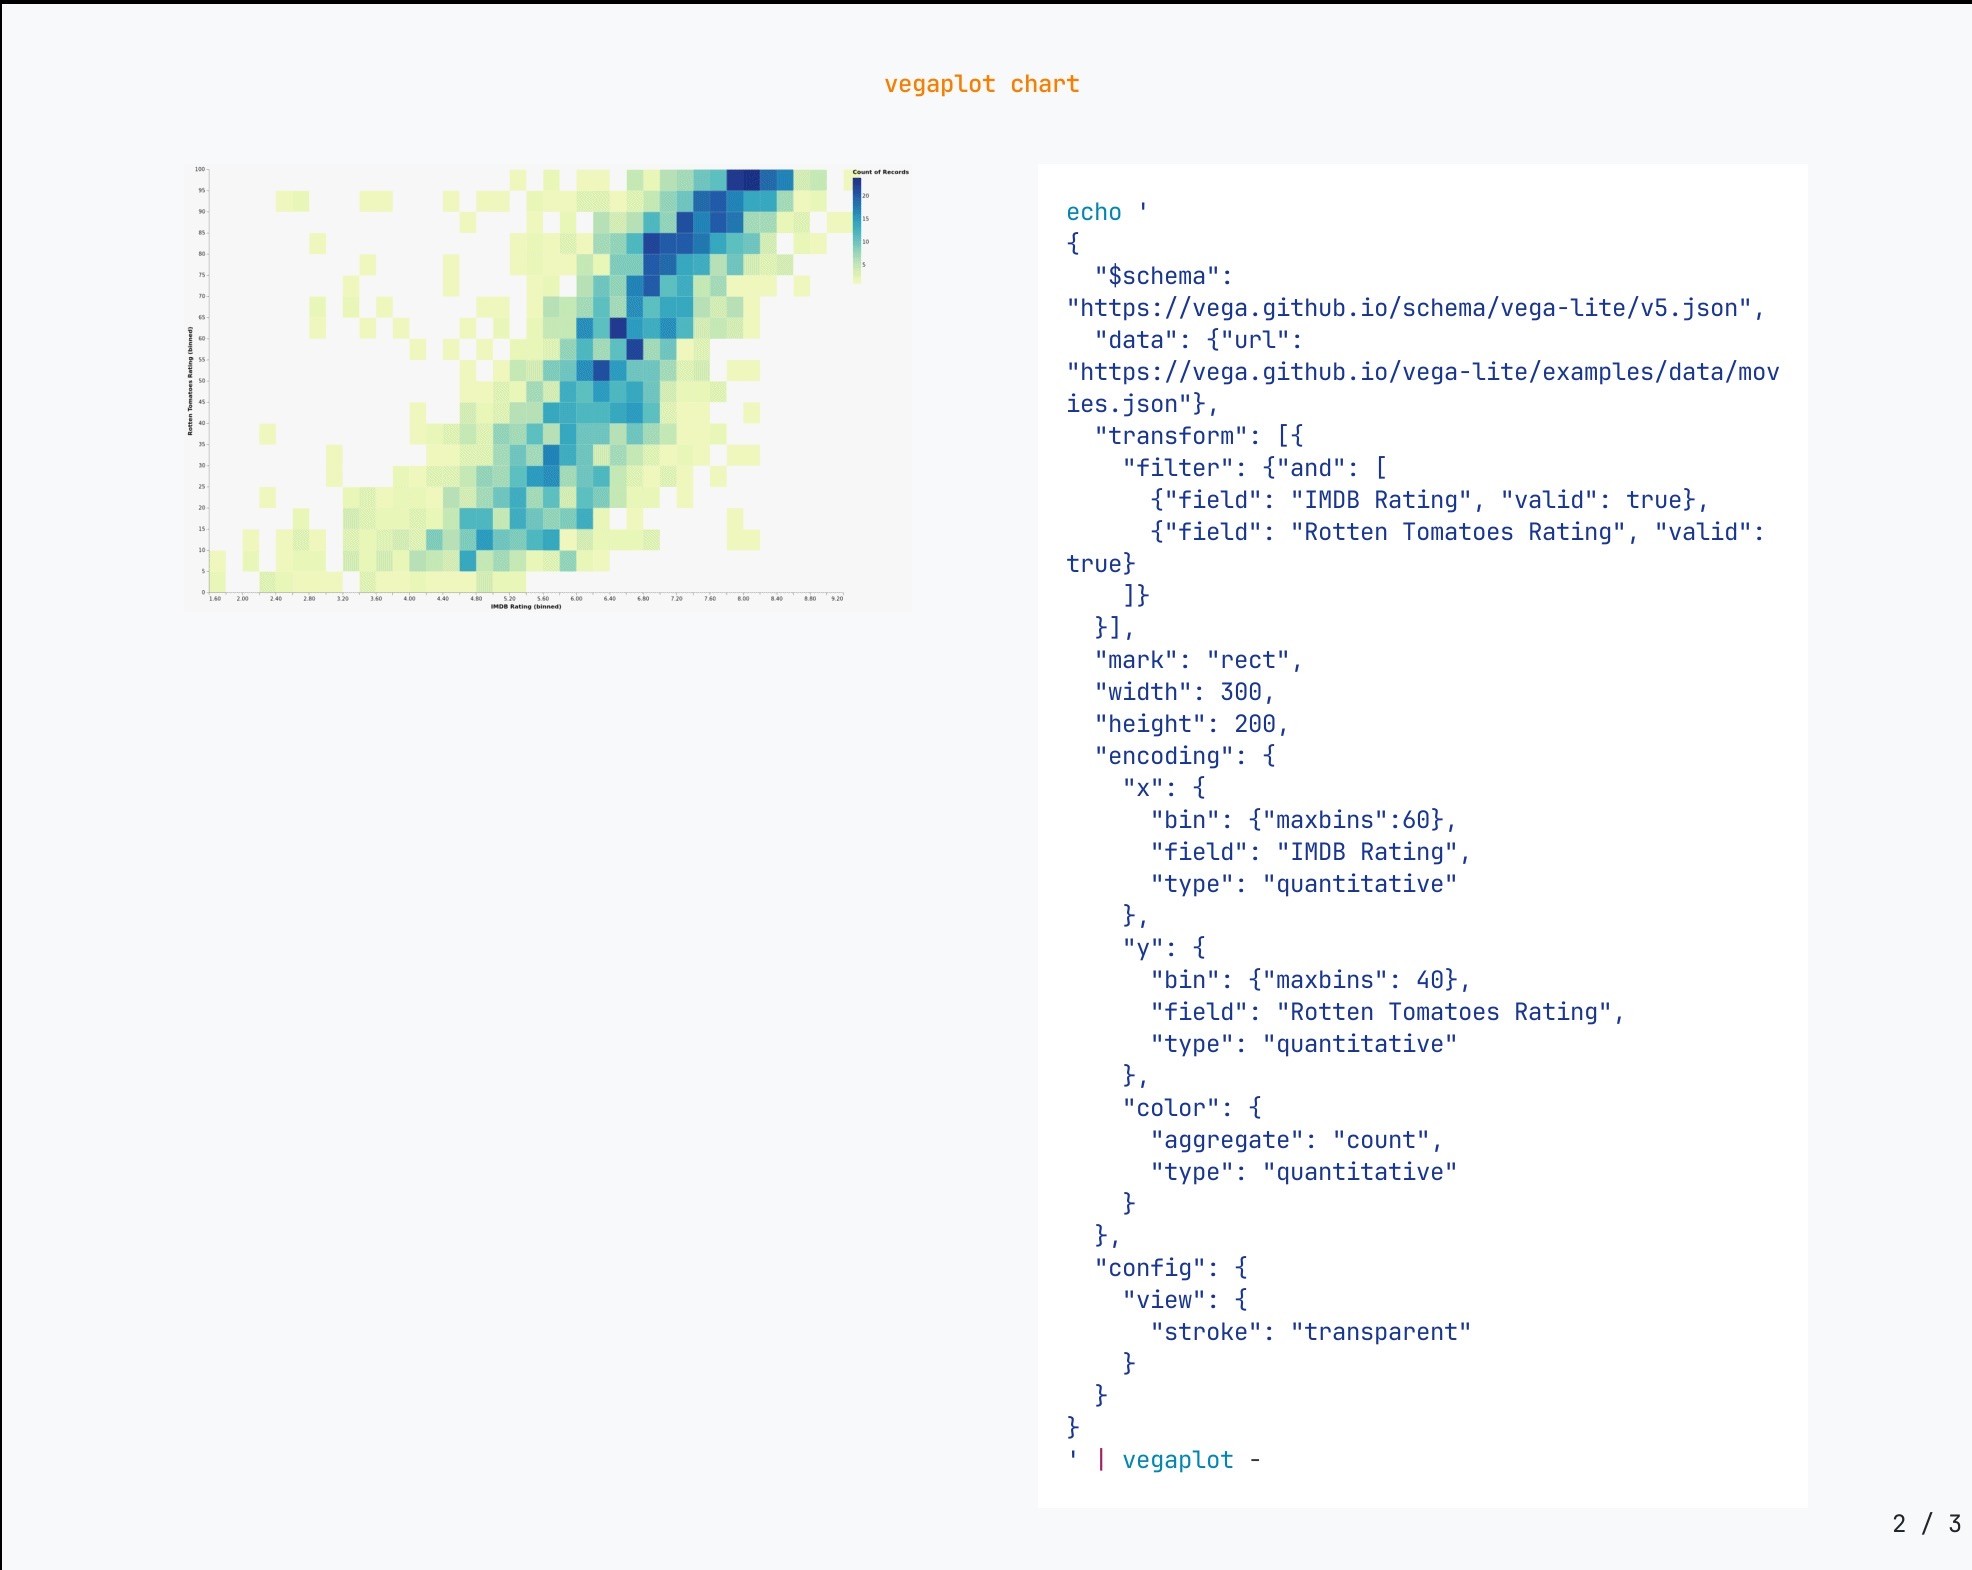
janantos@mstdn.socialI really love #presenterm #linux console slides tool, it is great does have #sixel support. But I haven’t found reasonable tool for charts. I mean #gnuplot is great, but I find myself impossible for me to produce heatmap there. So I have produced in one or two hours command line tool (read code glue) consuming vega-lite high level grammar of interactive graphics to do the job. So I can plot directly in #terminal and presentern. Now I am afraid to release those about 50 lines of typescript.
Jarkko Sakkinen
jarkko
There's support for Sixel, Kitty Image Protocol etc. And recent versions of Julia don't crash as much as it used to :-) Would not use it for calculating trajectories for missiles or space rockets but for my daily use it is definitely good enough...
https://github.com/eschnett/SixelTerm.jl
https://github.com/eschnett/SixelTerm.jl
Jan Antoš
janantos@mstdn.social@jarkko I don’t need to make any calculations I need to plot on simple csv data and that’s all. What I like that vega simple loads data also from remote sources and all I need to describe visualisation. And also I know vega well.

