Posts
209Following
26Followers
446Steven Rostedt
rostedtSteven Rostedt
rostedtSteven Rostedt
rostedtSteven Rostedt
rostedtWith my new persistent memory mapped ring buffer, were I can retrieve the tracing buffer from the previous boot that crashed, I was able to debug a recent issue. To do this, I added code to allow trace_printk() to be directed to the persistent ring buffer, along with enabling the printk console trace event (writes all printk()s to the tracing ring buffer), I was able to get the perfect idea of what was happening that lead up to the crash!
https://lore.kernel.org/lkml/20240823013902.135036960@goodmis.org/
Steven Rostedt
rostedtA tribute to Daniel Bristot de Oliveira from Linux Plumbers. https://lpc.events/blog/current/index.php/2024/07/06/in-memory-of-daniel-bristot-de-oliveira/
The Linux Foundation
linuxfoundation@social.lfx.devDaniel Bristot de Oliveira passed away on Monday, June 24th at the age of 37. Another sad loss for the Linux kernel developer community, Daniel will be sorely missed.
In memory of Daniel: https://t.co/kQCQyTCo1a
Steven Rostedt
rostedt@andree Actually, the issue is the opposite. What we have is a one size scheduler that fits everyone. But I think it’s more like all season tires. Where they suck in all seasons, but suck equally. The issue I found most frustrating with making changes to the scheduler, is that you may make a change that helps your specific workload, but will cause regressions in someone else’s workload, and your change much be reverted. Now you are stuck with either our of tree patches, or your workflow suffers.
I’m not a big fan of BPF, but I have been a long advocate for pluggable schedulers. My preference would have been true kernel modules, or config options (like file systems), as BPF programs are IMO harder to collaborate on.
Steven Rostedt
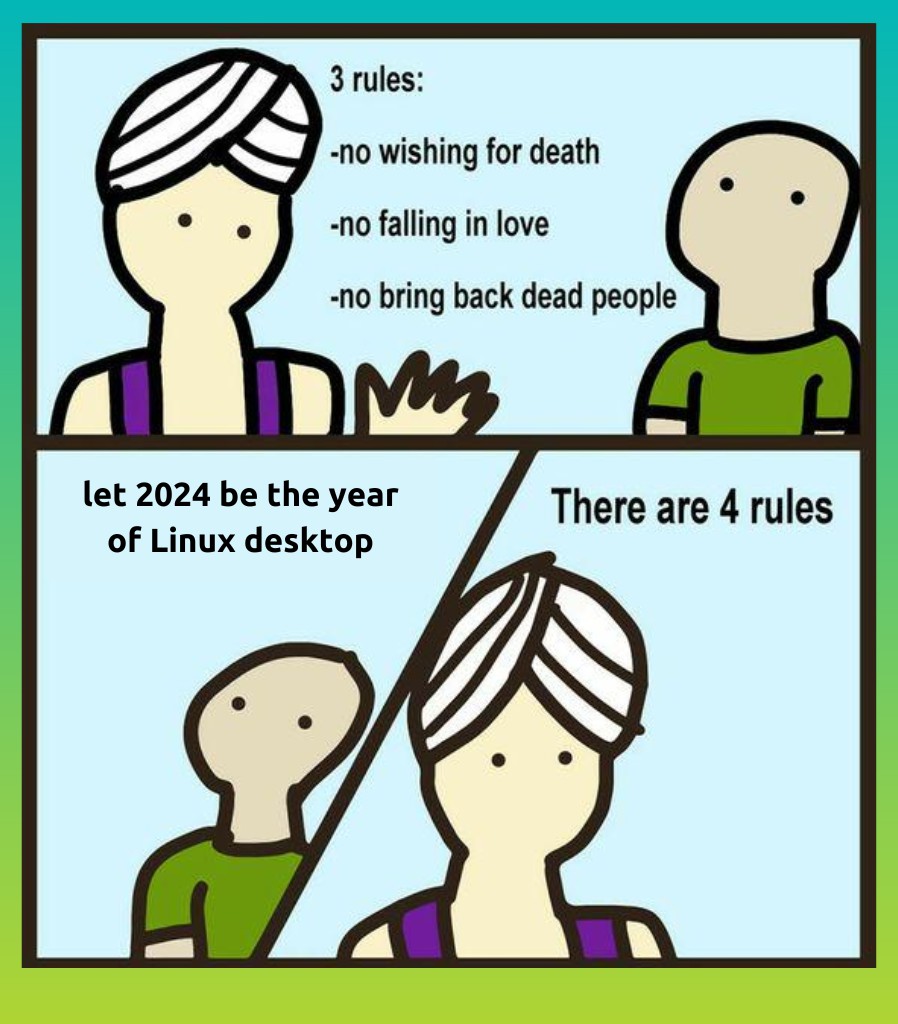
rostedt[ stolen from a colleague ]

Steven Rostedt
rostedt
Steven Rostedt
rostedtLinux Plumbers 2024 has accepted 9 Microconferences! But we had 26 submissions for 18 slots! What to do with that? Read about it here: https://lpc.events/blog/current/index.php/2024/05/03/awesome-amount-of-microconference-submissions/
Steven Rostedt
rostedt@jann @vbabka @T_X @kees Note, the CONFIG_PSTORE_FTRACE just adds hooks into the ftrace infrastructure to have it write into the pstore. What I did is different. Here you give the ftrace infrastructure a block of memory (starting address and size), and it will map its ring buffer on top of that. There’s no hooks. All functionality of ftrace will write into the that range of memory.
Yes, if pstore can give me a block of memory, I’ll use it. Really, the code I wrote just lets you use any block of memory. How I get that block of memory is part 2 of his story. 😉
Steven Rostedt
rostedthttps://lore.kernel.org/lkml/20240306015910.766510873@goodmis.org/
Steven Rostedt
rostedt@kernellogger But what if that “crazy” operation is actually documented in a man page?
 mkdir /tmp/tracing
# cp -r /sys/kernel/tracing/events /tmp/tracing
# exit
$ trace-cmd sqlhist -t /tmp/tracing ...
https://trace-cmd.org/Documentation/trace-cmd/trace-cmd-sqlhist.1.html
Steven Rostedt
rostedtDoing some testing against a change; I ran two traces. Recording the trace before applying the patch as trace-b.dat and then calling the trace file after applying the patch as trace-a.dat. Then doing an ls trace*.dat I have:
trace-a.dat
trace-b.dat
And it looks like trace-a.dat should come before trace-b.dat. I’m so confused! 😛

