Posts
30Following
273Followers
296Omar Sandoval
osandov
 0
0
 2
2
 2
2
Omar Sandoval
osandov
0
4
8
Omar Sandoval
osandov
0
4
7
repeated
Thorsten Leemhuis (acct. 1/4)
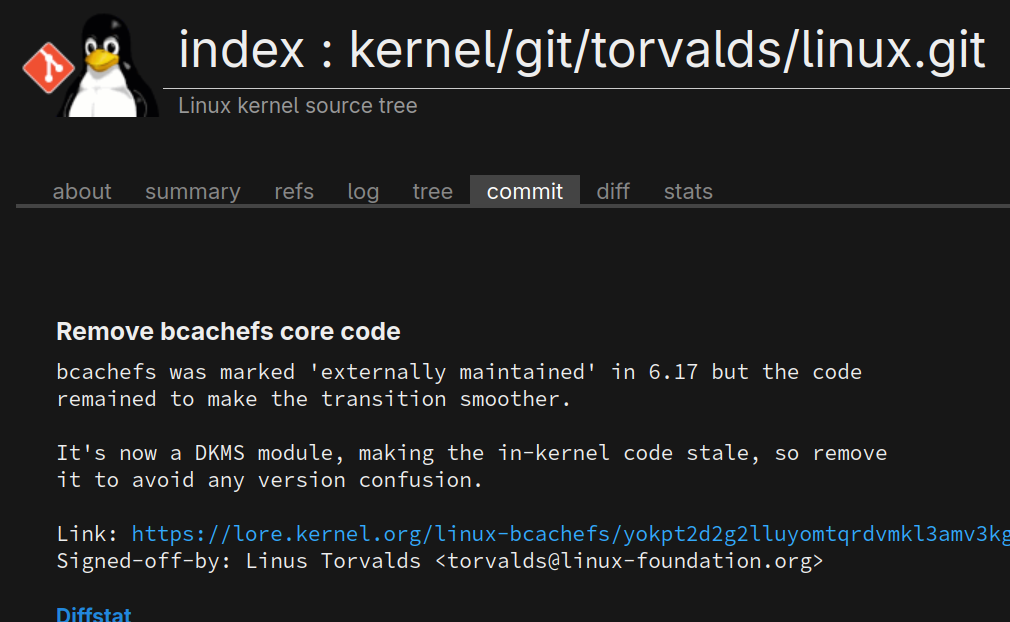
kernellogger@hachyderm.ioLinus removed #bcachefs from mainline, it thus will be gone as of #Linux 6.18:
https://git.kernel.org/torvalds/c/f2c61db29f277b9c80de92102fc532cc247495cd
""bcachefs was marked 'externally maintained' in 6.17 but the code remained to make the transition smoother.
It's now a DKMS module, making the in-kernel code stale, so remove it to avoid any version confusion.""
284 files changed, 0 insertions, 117483 deletions
 3
7
0
repeated
3
7
0
repeated
sj
sj[1] https://social.kernel.org/notice/AZrKdcNdDyaDwkShou
[2] https://static.sched.com/hosted_files/osseu2023/92/damo_ossummit_eu_2023.pdf
[3] https://kangrejos.com/
[4] https://kernel-recipes.org/en/2025/schedule/overcoming-observer-effects-in-memory-management-with-damon/
[5] https://github.com/damonitor/talks/blob/master/2025/kernel_recipes/damon_kernel_recipes2025.pdf
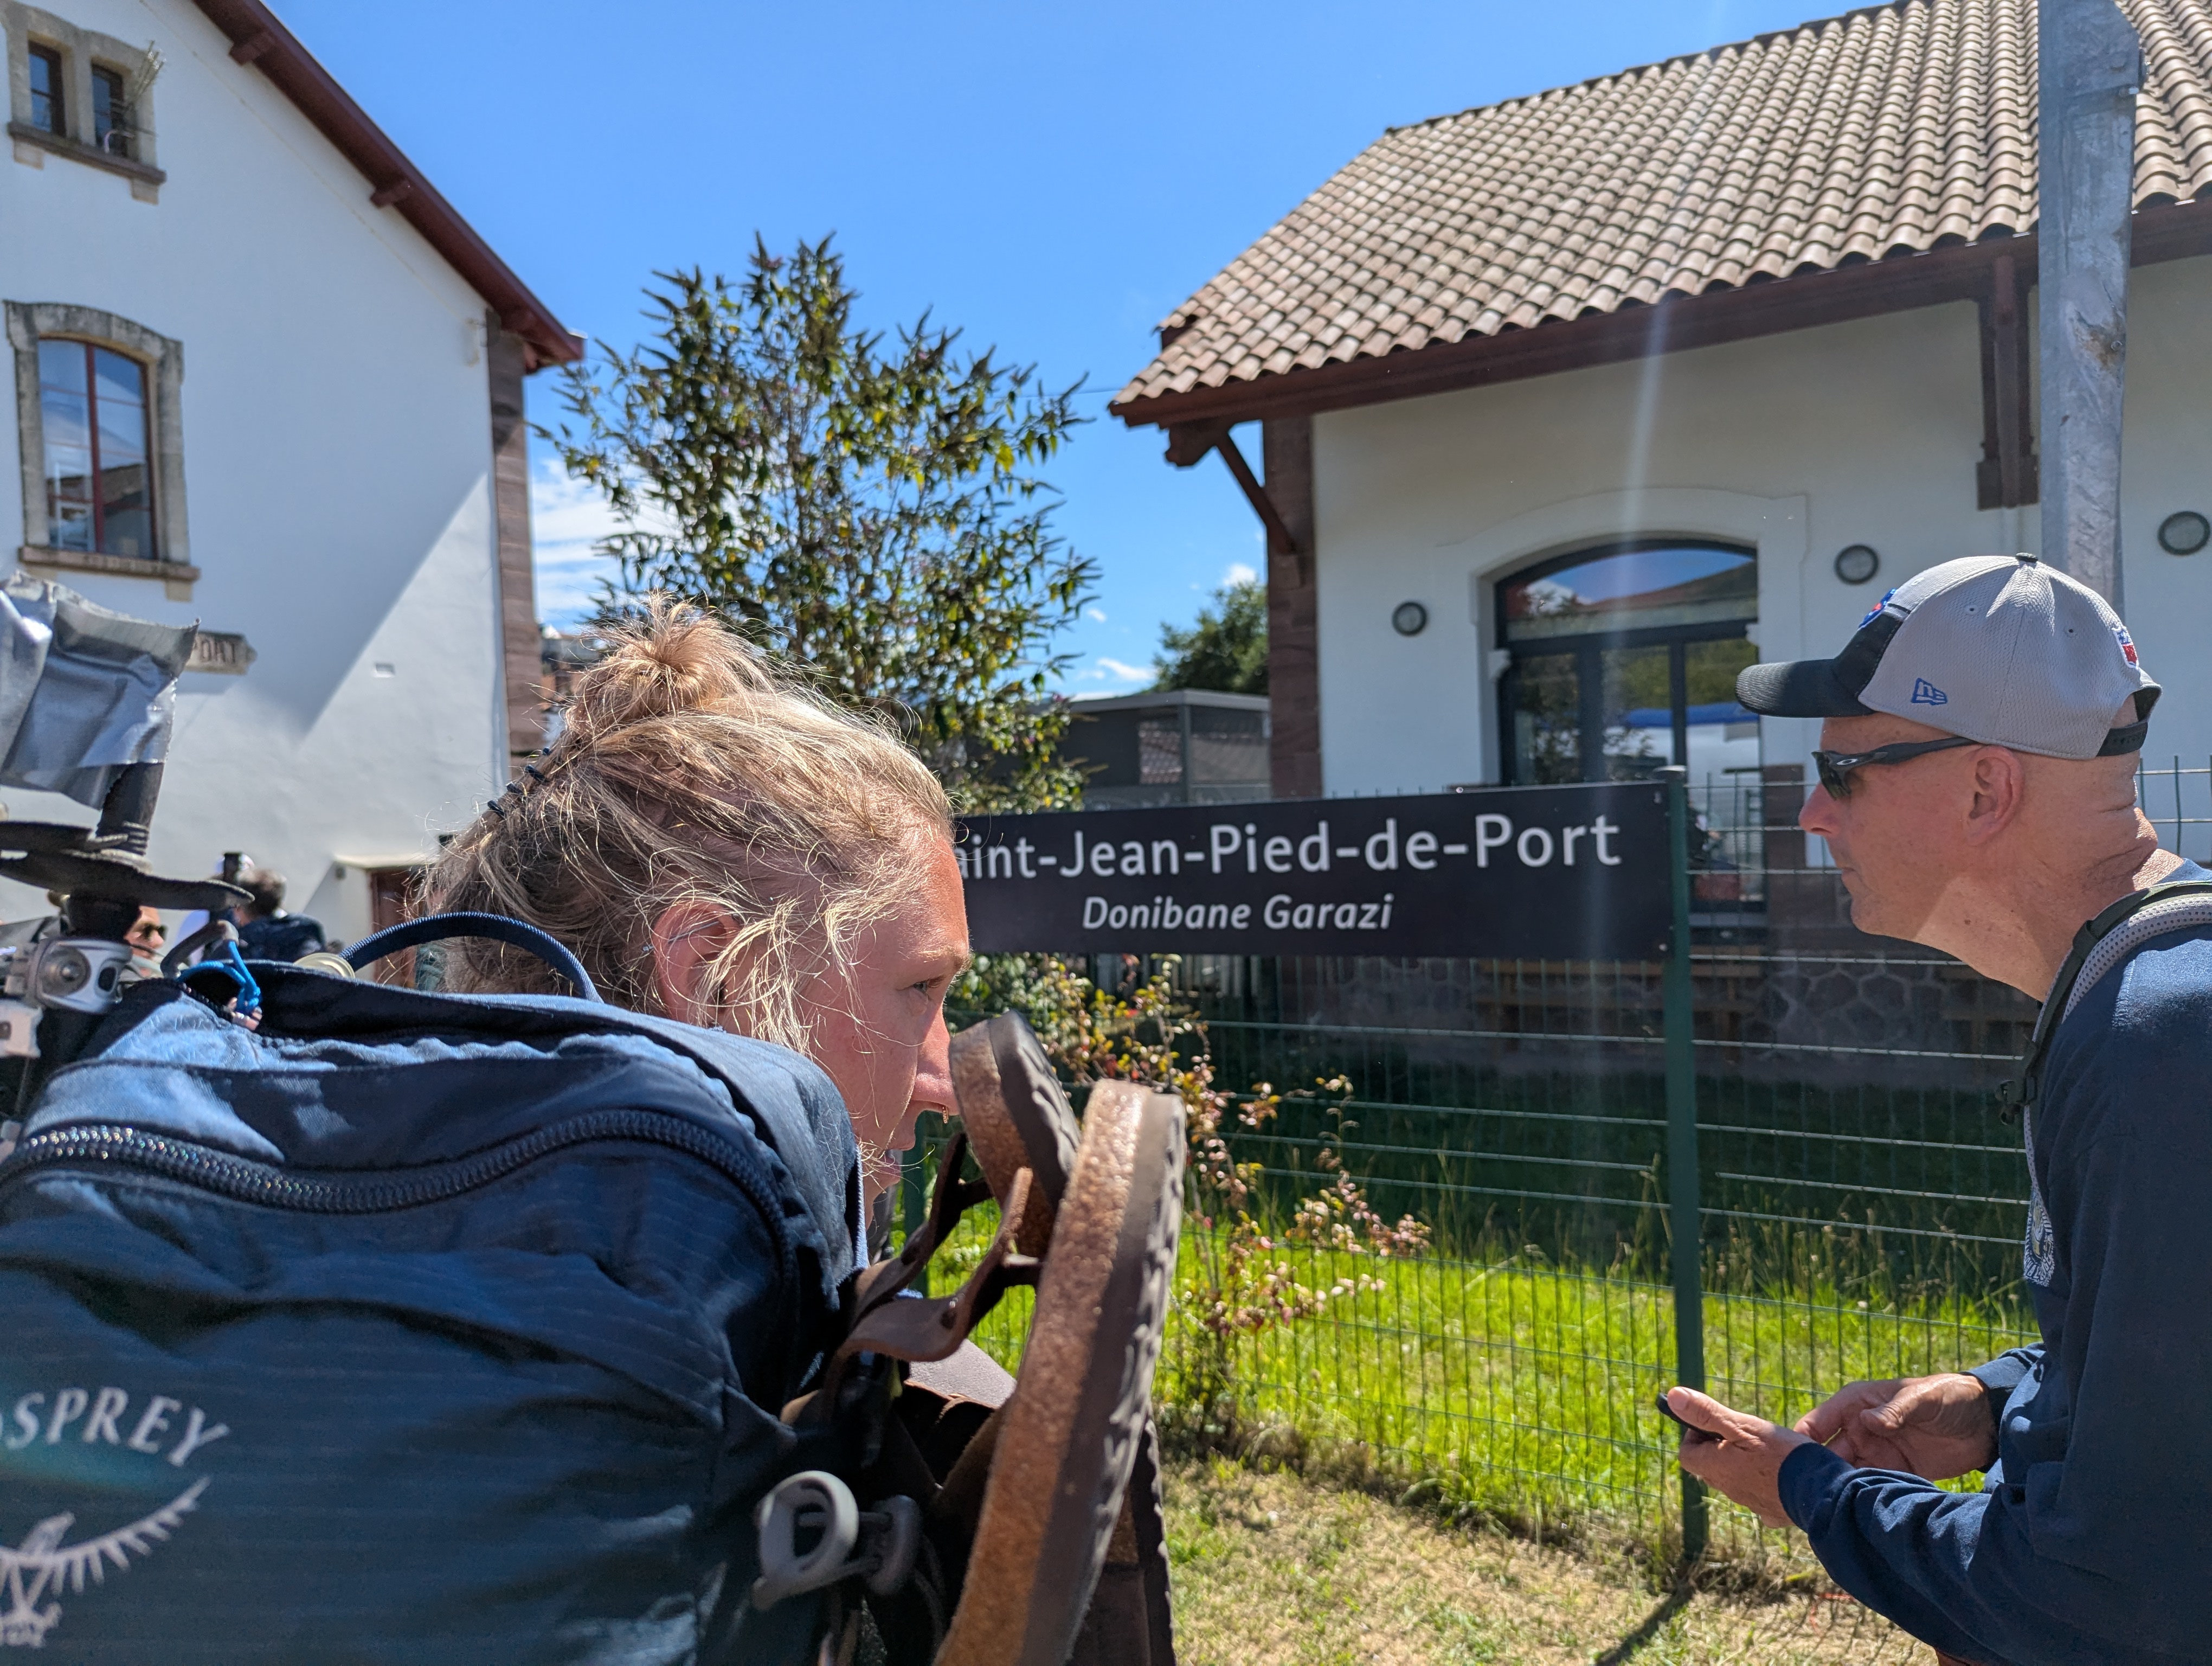
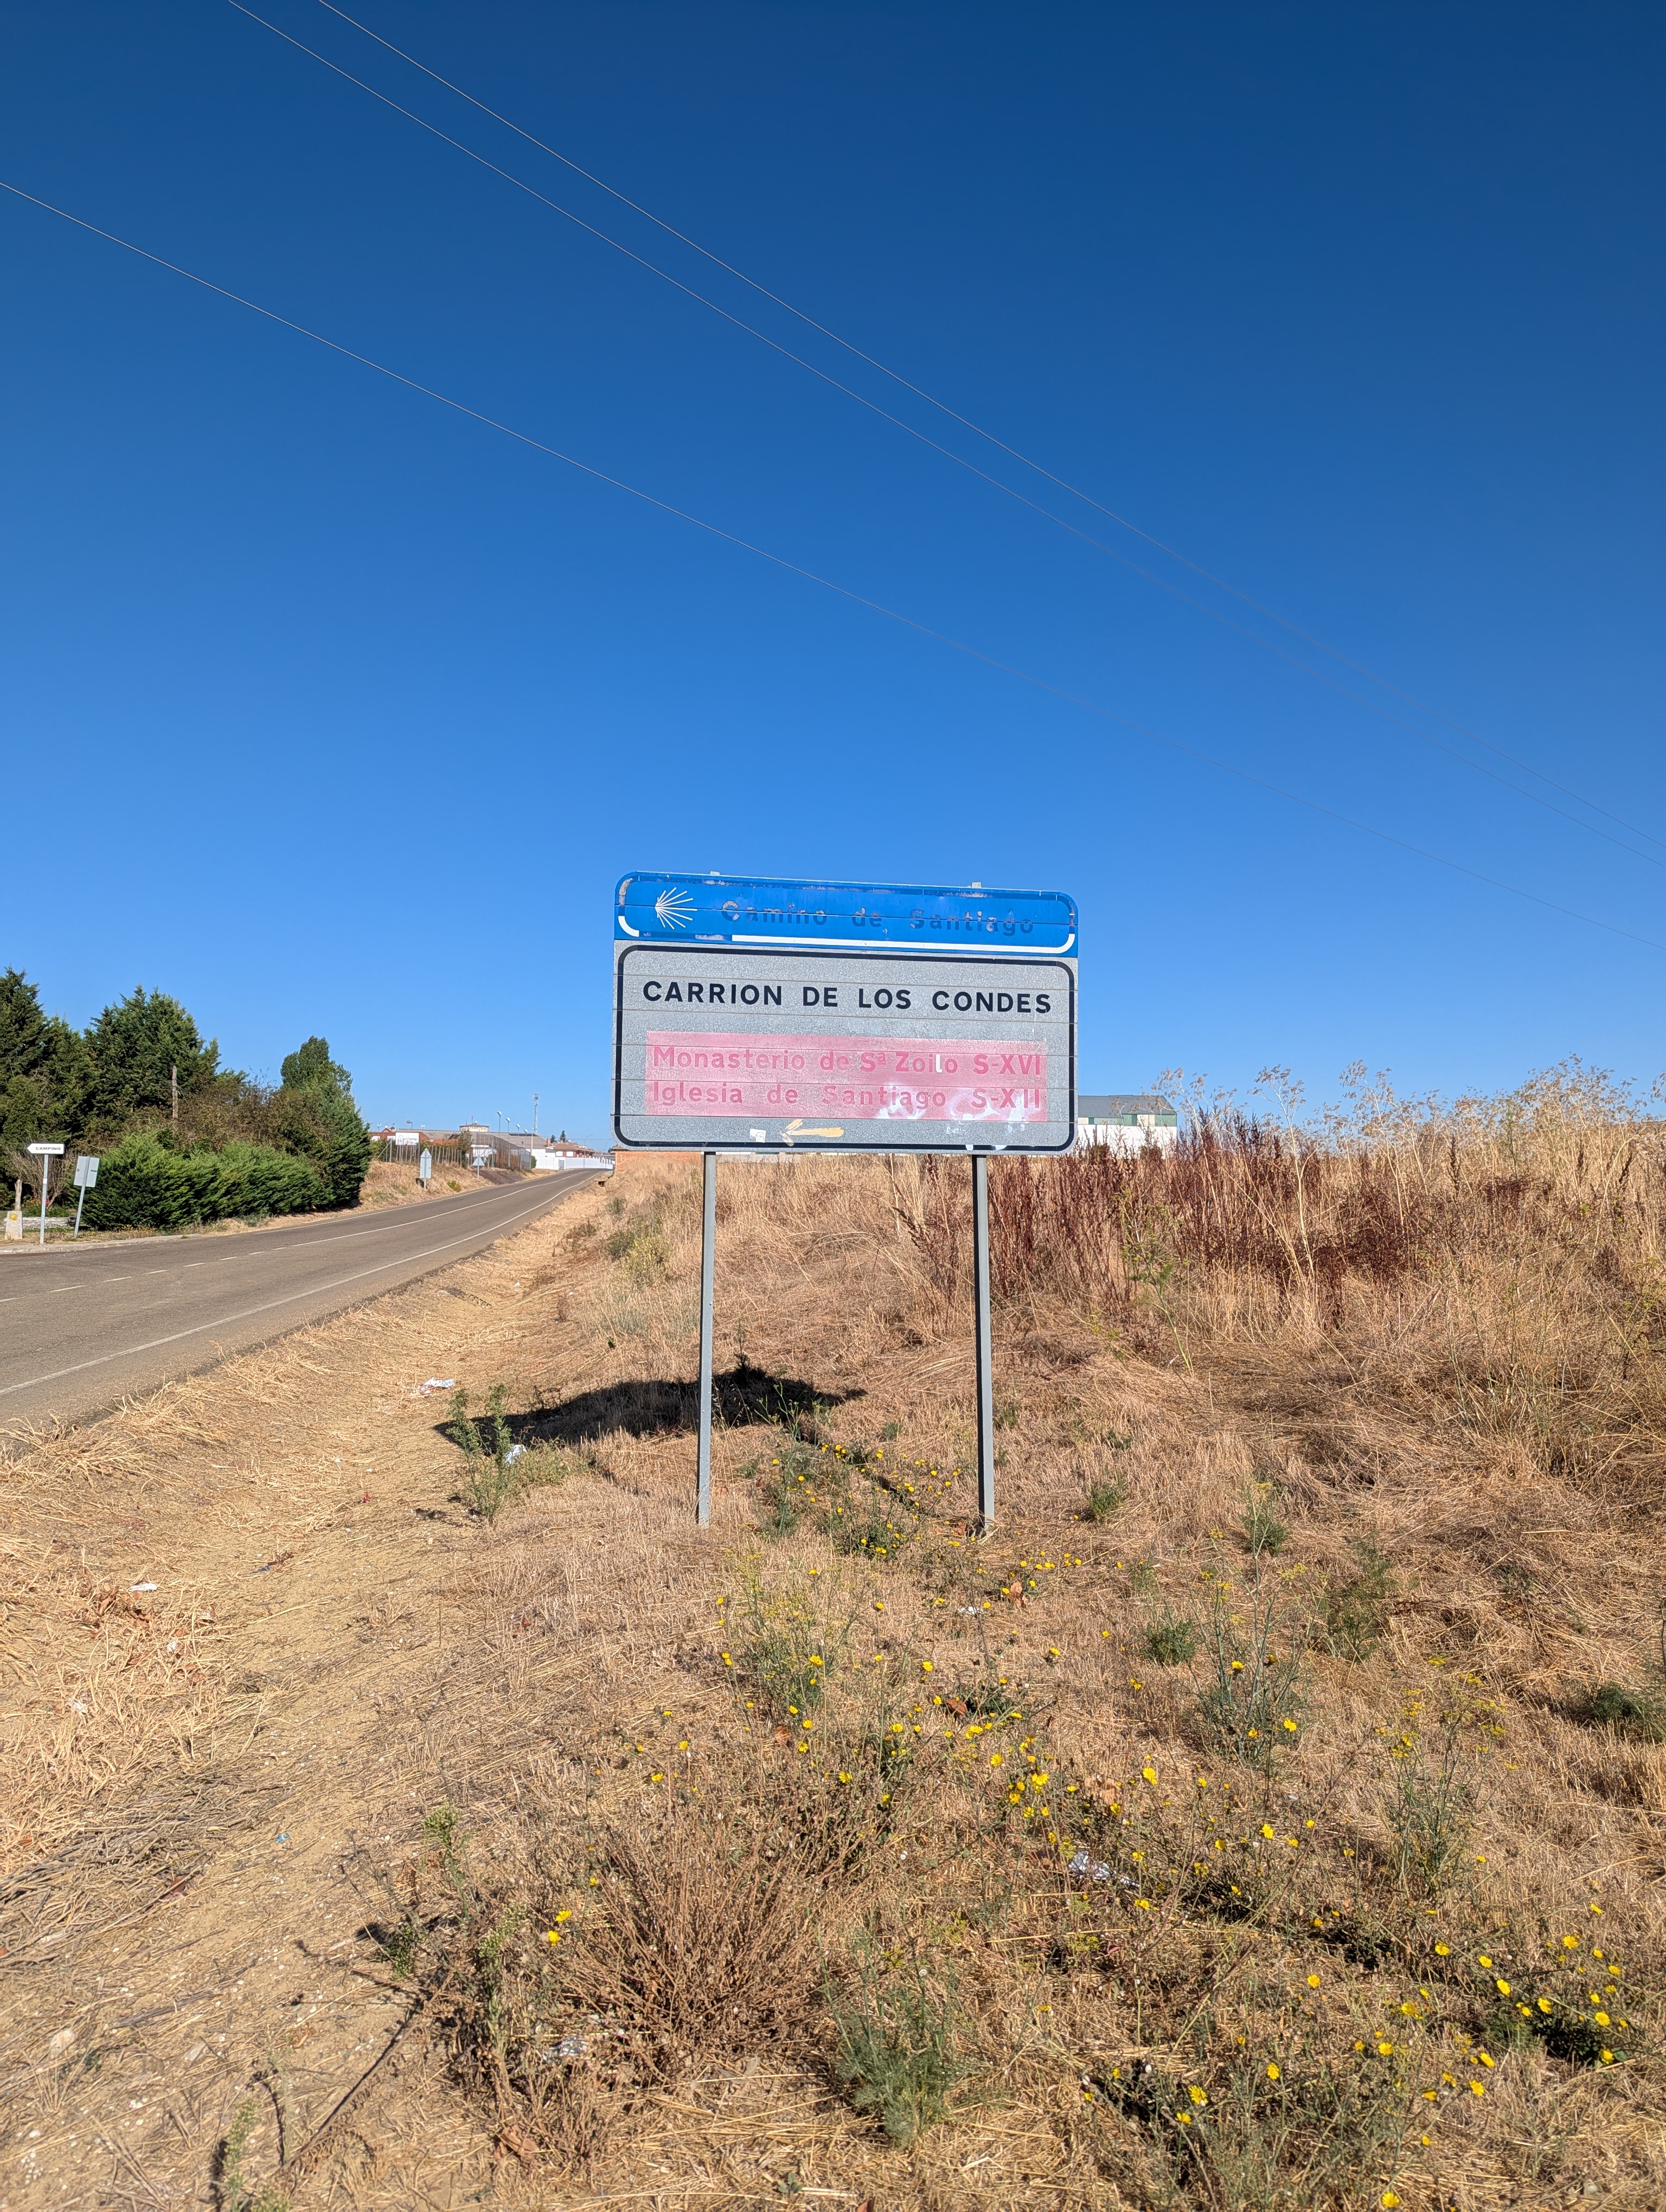
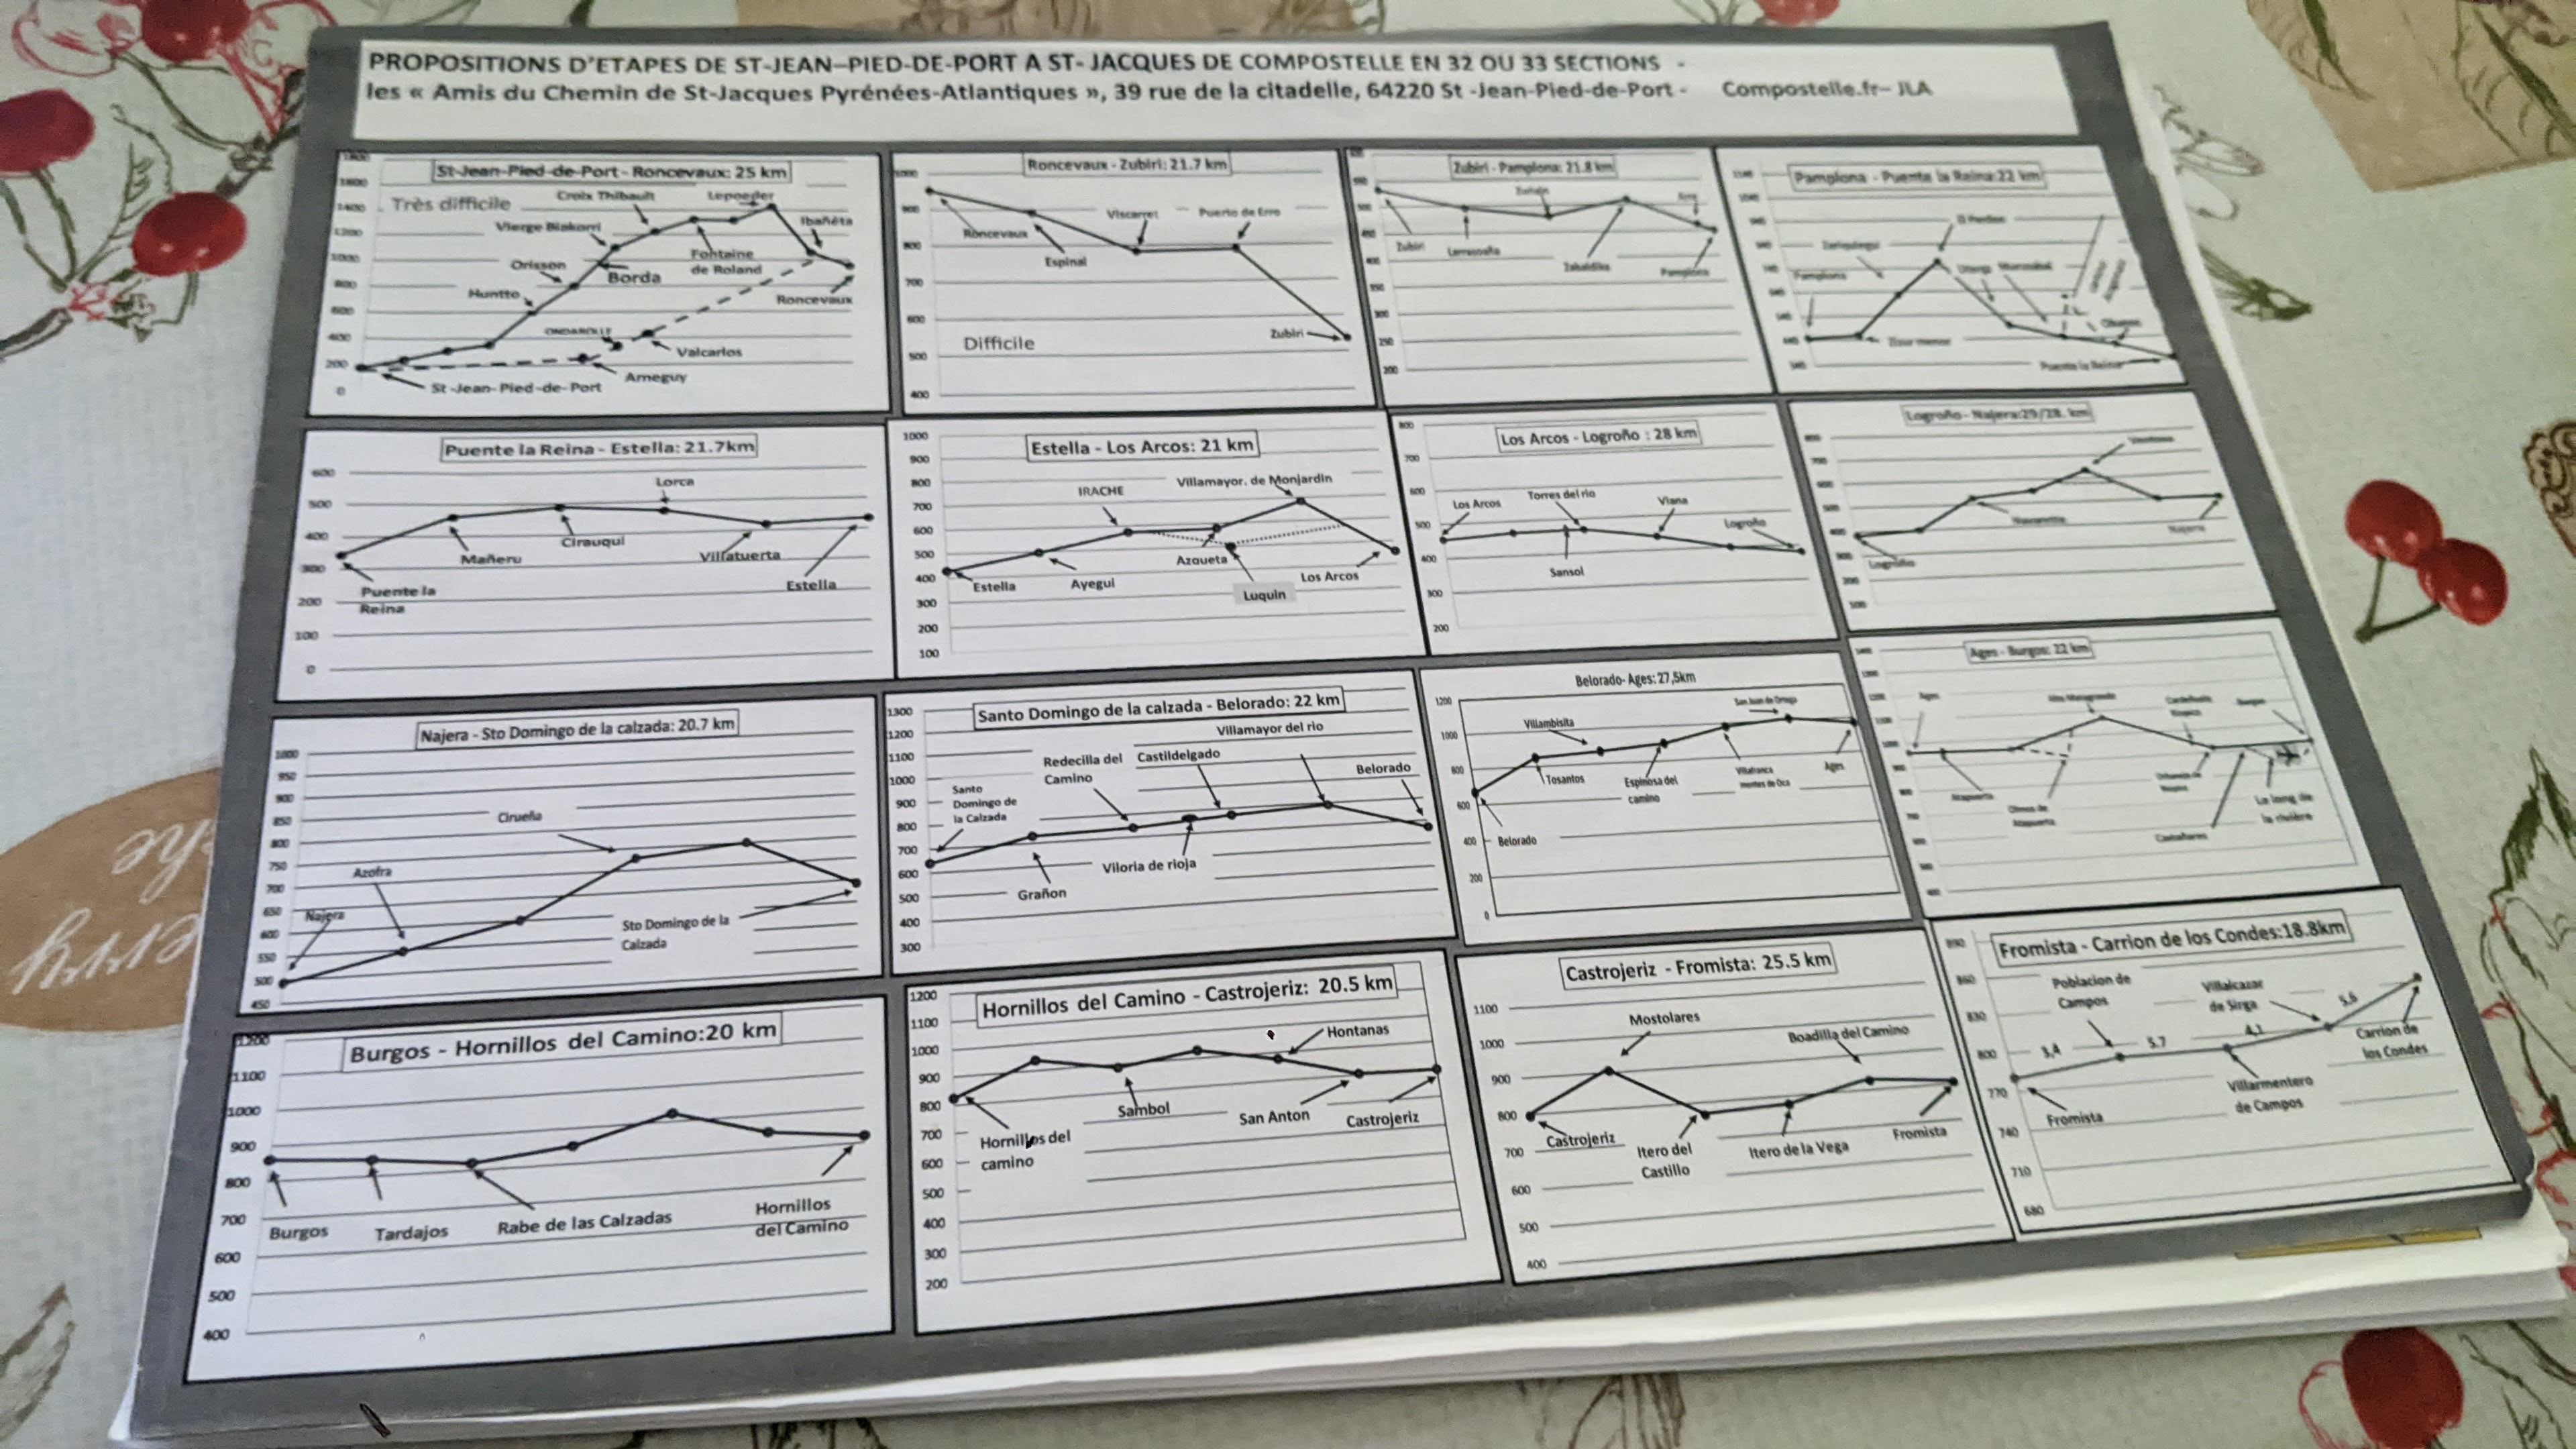
#kangjeros #kernelrecipes #caminodesantiago

 0
2
6
0
2
6
Omar Sandoval
osandov
0
0
2
repeated
Omar Sandoval
osandovWhat is the purpose of the slab->frozen flag, and why do frozen slabs have slab->inuse == slab->objects?
2
0
1
Omar Sandoval
osandovOriginally, a single struct address_space served as the swap cache for every swap file.
In 2013, Shaohua Li split it up into a separate address_space per swap file: https://git.kernel.org/pub/scm/linux/kernel/git/torvalds/linux.git/commit/?id=33806f06da654092182410d974b6d3c5396ea3eb.
In 2017, Ying Huang split it further into a separate address_space for each 64MB chunk of each swap file: https://git.kernel.org/pub/scm/linux/kernel/git/torvalds/linux.git/commit/?id=4b3ef9daa4fc0bba742a79faecb17fdaaead083b. That's how it's been sharded ever since.
1
0
3
repeated
Björkus "No time_t to Die" Dorkus
thephd@pony.socialYou hear that Mr. Kernighan? ... That is the
sound of inevitability... It is the sound
of improvement...
It's time, Mr. Kernighan....
 5
1
1
5
1
1
Omar Sandoval
osandovAnd yet the "non-technical" aspects are just as important to Linux's technical excellence. I can't remember where I read that Linux's true innovation wasn't its design, but rather its development model, but it's true. Linux isn't defined by a single, great technical decision. Instead, it's great because it's constantly evolving through collaboration. Jeopardizing that is a much bigger deal than any single feature.
0
0
2
Omar Sandoval
osandov
1
0
2
repeated
Richard Weinberger
rwStep 1: While debugging a kernel issue, you want the return value of a function at startup.
Step 2: Instead of just adding a
printk()and recompiling, you try tracing like the cool kids.Step 3: Since 2023, the function graph tracer can show return values. You add to the kernel command line and reboot:
ftrace=function_graph ftrace_filter=interesting_fn trace_options=funcgraph-retvalStep 4: The trace shows no return value. You find that ARM return value capture exists only for AArch64, not ARM32.
Step 5: You add a
printk()and rebuild.
2
8
14
Omar Sandoval
osandovIt always makes me laugh because it was added in 2006 (https://git.kernel.org/pub/scm/linux/kernel/git/torvalds/linux.git/commit/?id=e977145aeaad23d443686f2a2d5b32800d1607c5) for an obscure architecture that the kernel dropped support for in 2018 (https://git.kernel.org/pub/scm/linux/kernel/git/torvalds/linux.git/commit/?id=c690eddc2f3b44b24520f4a77cc3a4c9bde7d571).
2
1
3
repeated
Christian Brauner 🦊🐺
brauner@mastodon.socialShow content
Yes, to all of it.
https://lore.kernel.org/all/20250809192156.GA1411279@fedora/
3
8
2
repeated
Jonathan Corbet
corbetThat maintainer, Masahiro Yamada, has just stepped down after eight years on the job:
https://web.git.kernel.org/pub/scm/linux/kernel/git/torvalds/linux.git/commit/?id=8d6841d5cb20
Happily, Nathan Chancellor and Nicolas Schier have agreed to pick up the build system. The configuration system, instead, is now unmaintained. That ... seems less than optimal.
Thanks to Masahiro for doing this work all these years, and to Nathan and Nicolas for stepping up!
3
20
51
Omar Sandoval
osandov
0
3
6
Omar Sandoval
osandov 1
0
1
1
0
1